
Berkas:Measles cases graph.svg

Ukuran asli (Berkas SVG, secara nominal 750 × 390 piksel, besar berkas: 12 KB)
Ringkasan
| Deskripsi |
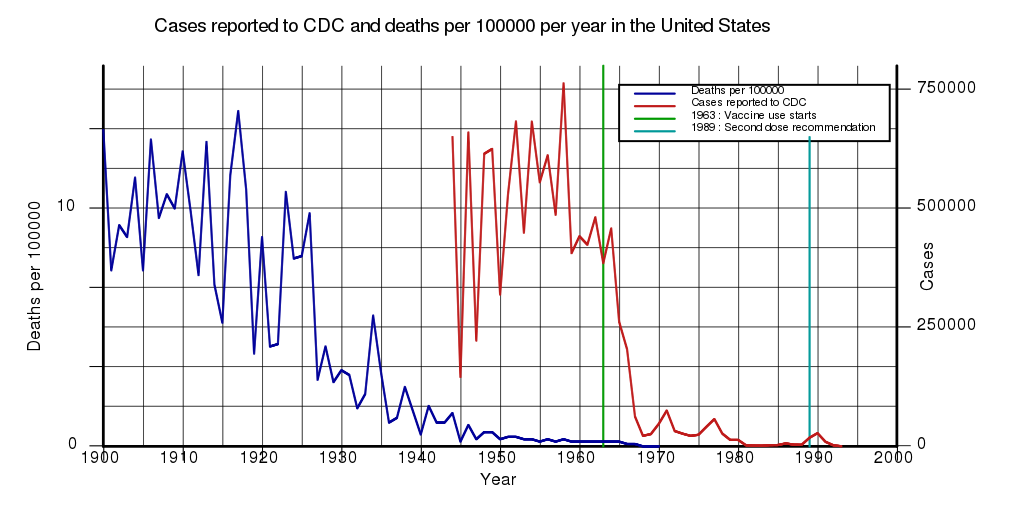
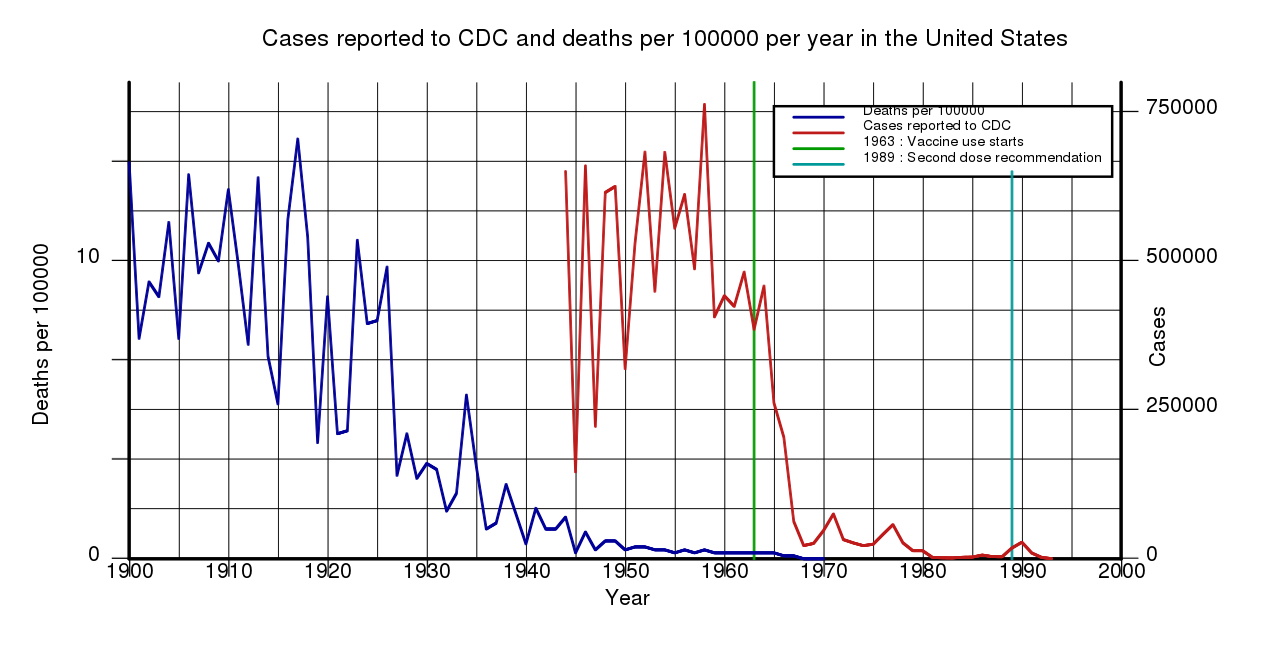
English: Measles deaths per 100000 and cases reported to the CDC, per year, in the United States, during the 20th century |
| Tanggal | |
| Sumber | Karya sendiri |
| Pembuat | Arthurwolf~enwiki |
Technical details
This page created using https://commons.wikimedia.org/wiki/Template:SVG_Chart
Source is in the "Discussion" tab for this page.
Data is on this page, including the links to where it was found.
Data source
- For deaths : Root CDC data repository : Vital Statistics of the United States
- Vital Statistics Rates in the United States, 1900-1940, various tables, Measles data
- Vital Statistics Rates in the United States, 1940-1960, table 65: Death rates for detailed causes, Measles data
- Statistics for 1960-1964, document for each year.
- Statistics for 1965-1979, document for each year.
- For cases :
- Data Source for the number of cases ( and not deaths ), the same source as the original graph I am trying to improve or replace.
There is also some sort of query system allowing to get raw data in easily re-usable formats by defining searches. I was able to get pretty far with the system, selecting for all measles deaths stats in the 20th century, but for some reason was not able to get to usable data. If somebody knows how to use this tool and obtain the data I would be very interested to know what I did wrong, as it seems like a very cool tool.
Raw Data
Measles Deaths per 100 000 population, per year, extracted manually from the documents in the Sources section
1900 13.3
1901 7.4
1902 9.3
1903 8.8
1904 11.3
1905 7.4
1906 12.9
1907 9.6
1908 10.6
1909 10.0
1910 12.4
1911 9.9
1912 7.2
1913 12.8
1914 6.8
1915 5.2
1916 11.4
1917 14.1
1918 10.8
1919 3.9
1920 8.8
1921 4.2
1922 4.3
1923 10.7
1924 7.9
1925 8.0
1926 9.8
1927 2.8
1928 4.2
1929 2.7
1930 3.2
1931 3.0
1932 1.6
1933 2.2
1934 5.5
1935 3.1
1936 1.0
1937 1.2
1938 2.5
1940 0.5
1941 1.7
1942 1.0
1943 1.0
1944 1.4
1945 0.2
1946 0.9
1947 0.3
1948 0.6
1949 0.6
1950 0.3
1951 0.4
1952 0.4
1953 0.3
1954 0.3
1955 0.2
1956 0.3
1957 0.2
1958 0.3
1959 0.2
1960 0.2
1961 0.2
1962 0.2
1963 0.2
1964 0.2
1965 0.2
1966 0.1
1967 0.1
1968 0
1969 0
1970 0

Deaths total, independent of the total population

1982 2
1983 4
1984 1
1985 4
1986 2
1987 2
1988 3
1989 32
1990 64
1991 27
Note: I could not find the data for 1939 anywhere, it is missing from all the documents I searched. I left the year empty/missing in my data, so the graphing tool/template will simply trace a line from 1938 to 1940 directly. I do not think this will have a very big impact on what the data shows overall.
If somebody has the data I would be very interrested in it. Or if you have some explanation for why I couldn't find it, that would be great too.
It just now occurs to me that 1939 isn't just any year, maybe that's related?
Measles cases in the United States, per year, extracted from the same source as the original graph
1944 650291
1945 146013
1946 659843
1947 222375
1948 615104
1949 625281
1950 319124
1951 530118
1952 683077
1953 449146
1954 682720
1955 555156
1956 611936
1957 486799
1958 763094
1959 406162
1960 441703
1961 423919
1962 481530
1963 385156
1964 458083
1965 261904
1966 204136
1967 62705
1968 22231
1969 25826
1970 47351
1971 75290
1972 32275
1973 26690
1974 22094
1975 24374
1976 41126
1977 57345
1978 26871
1979 13597
1980 13506
1981 2124
1982 1714
1983 1497
1984 2587
1985 2822
1986 6282
1987 3655
1988 3396
1989 18193
1990 27786
1991 9643
1992 2237
1993 312
Lisensi
- Anda diizinkan:
- untuk berbagi – untuk menyalin, mendistribusikan dan memindahkan karya ini
- untuk menggubah – untuk mengadaptasi karya ini
- Berdasarkan ketentuan berikut:
- atribusi – Anda harus mencantumkan atribusi yang sesuai, memberikan pranala ke lisensi, dan memberi tahu bila ada perubahan. Anda dapat melakukannya melalui cara yang Anda inginkan, namun tidak menyatakan bahwa pemberi lisensi mendukung Anda atau penggunaan Anda.
- berbagi serupa – Apabila Anda menggubah, mengubah, atau membuat turunan dari materi ini, Anda harus menyebarluaskan kontribusi Anda di bawah lisensi yang sama seperti lisensi pada materi asli.
Riwayat berkas
Klik pada tanggal/waktu untuk melihat berkas ini pada saat tersebut.
| Tanggal/Waktu | Miniatur | Dimensi | Pengguna | Komentar | |
|---|---|---|---|---|---|
| terkini | 27 Juli 2019 13.56 | | 750 × 390 (12 KB) | Arthurwolf~enwiki | User created page with UploadWizard |
Penggunaan berkas
Tidak ada halaman yang menggunakan berkas ini.
Penggunaan berkas global
Wiki lain berikut menggunakan berkas ini:
- Penggunaan pada en.wiki-indonesia.club
- Penggunaan pada he.wiki-indonesia.club
- Penggunaan pada hy.wiki-indonesia.club
- Penggunaan pada tr.wiki-indonesia.club
- Penggunaan pada uz.wiki-indonesia.club