
Berkas:Tropospheric profile Uranus.png

Ukuran pratayang ini: 776 × 600 piksel. Resolusi lainnya: 311 × 240 piksel | 621 × 480 piksel | 994 × 768 piksel | 1.280 × 989 piksel | 2.560 × 1.978 piksel | 3.300 × 2.550 piksel.
Ukuran asli (3.300 × 2.550 piksel, ukuran berkas: 110 KB, tipe MIME: image/png)
Ringkasan
| Deskripsi |
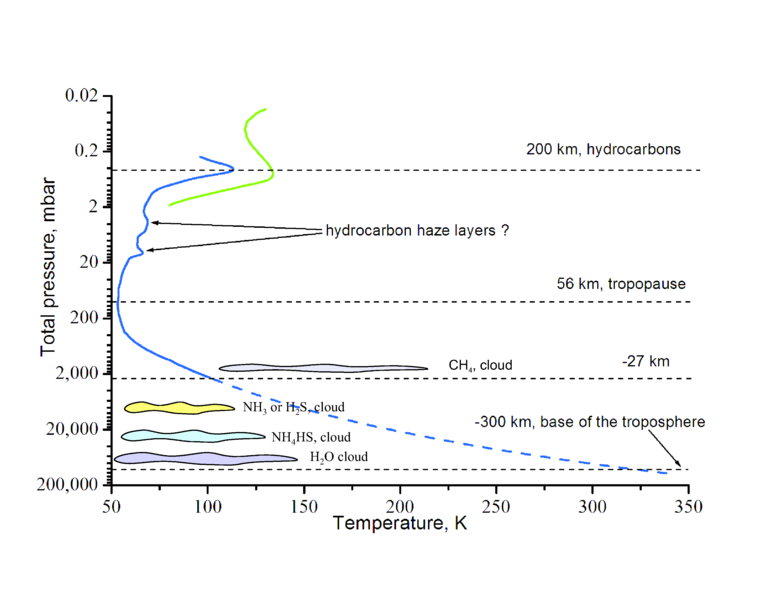
English: This graph shows temperature profile in the en:troposphere and in the lower en:stratosphere of en:Uranus. Heights are also indicated.
References
|
| Tanggal | 25 Agustus 2007 (original upload date) |
| Sumber | Karya sendiri (Teks asli: Self-made) |
| Pembuat | Ruslik0 |
| Versi lainnya |
Lisensi
Ruslik0 at the English Wikipedia, pemilik hak cipta dari karya ini, dengan ini menerbitkan berkas ini di bawah ketentuan berikut:

|
Diizinkan untuk menyalin, mendistribusikan dan/atau memodifikasi dokumen ini di bawah syarat-syarat Lisensi Dokumentasi Bebas GNU, Versi 1.2 atau lebih baru yang diterbitkan oleh Free Software Foundation; tanpa Bagian Invarian, tanpa Teks Sampul Depan, dan tanpa Teks Sampul Belakang. Salinan lisensi dimasukkan ke bagian yang berjudul Lisensi Dokumentasi Bebas GNU. |
| Berkas on ipartandoan sian on Creative Commons Attribution-Share Alike 3.0 Unported partadoan. | ||
| Atribusi: Ruslik0 at the English Wikipedia | ||
| ||
| Label lisensi ini ditambahkan pada berkas sebagai bagian dari pemutakhiran lisensi GFDL. |
Log pengunggahan asli
Halaman deskripsi aslinya ada di sini. Semua nama pengguna berikut merujuk pada en.wikipedia.
- 2007-08-25 17:38 Ruslik0 3300×2550× (112338 bytes) This graph shows temperature profile in the troposphere and in the lower stratosphere of Uranus. Heights are also indicated. Blue curve is from Lindal, G.F., Lyons, J.R., Sweetnam, D.N., Eshleman, V.R., Hinson, D.P., Tyler, G.L., 1987. The atmosphere of
- 2007-08-25 13:51 Ruslik0 3300×2550× (96492 bytes) This graph shows temperature profile in the troposphere and in the lower stratosphere of Uranus. Heights are also indicated. Blue curve is from Lindal, G.F., Lyons, J.R., Sweetnam, D.N., Eshleman, V.R., Hinson, D.P., Tyler, G.L., 1987. The atmosphere of
Riwayat berkas
Klik pada tanggal/waktu untuk melihat berkas ini pada saat tersebut.
| Tanggal/Waktu | Miniatur | Dimensi | Pengguna | Komentar | |
|---|---|---|---|---|---|
| terkini | 1 Desember 2008 15.23 | | 3.300 × 2.550 (110 KB) | File Upload Bot (Magnus Manske) | {{BotMoveToCommons|en.wikipedia}} {{Information |Description={{en|This graph shows temperature profile in the en:troposphere and in the lower en:stratosphere of en:Uranus. Heights are also indicated. *The '''blue''' curve is from Lindal |
| 1 Desember 2008 15.23 |  | 3.300 × 2.550 (110 KB) | File Upload Bot (Magnus Manske) | {{BotMoveToCommons|en.wikipedia}} {{Information |Description={{en|This graph shows temperature profile in the en:troposphere and in the lower en:stratosphere of en:Uranus. Heights are also indicated. *The '''blue''' curve is from Lindal |
Penggunaan berkas
Halaman berikut menggunakan berkas ini:
Penggunaan berkas global
Wiki lain berikut menggunakan berkas ini:
- Penggunaan pada pl.wiki-indonesia.club
- Penggunaan pada zh.wiki-indonesia.club